Introduction
AMD inserted itself back into the CPU market as a true competitor last month with the release of the Ryzen 7 line of processors. The microchip manufacturer also set its eyes on the mid-range market with the release of the Ryzen 5 line. All these CPUs are based on the Zen microarchitecture, which is AMD’s strongest yet. Internally, AMD asserts that Zen outperforms its previous Excavator architecture by 52 percent in a battle of instructions per clock (IPC). In addition, Ryzen requires the new AM4 socket across all CPUs.
Here we have two SKUs of Ryzen 5 CPUs for review: the 1600X and 1500X, which retail for $249 USD and $189 USD, respectively. In terms of pricing, these CPUs are intended to compete with Intel’s Core-i5 series. AMD touts Ryzen’s advantage for “prosumers”--a mix of performance for professional tasks and consumer-level pricing. The Ryzen 7 1800X is positioned to compete against much more expensive Intel equivalents in video editing and image rendering tasks. If the Ryzen 5 CPUs scale accordingly, those looking for a balance of performance for productivity and gaming at a lower price should pay close attention.
- Introduction
- Technical Details
- Methodology
- Benchmark Results
- Cinebench R15
- X264 5.0.1 Pass 1
- X264 5.0.1 Pass 2
- 7-Zip
- GeekBench 3.0
- GeekBench 3.0 Single Core
- Blender
- PCMark 8 (Creative, Accelerated)
- 3DMark 11 (Physics Score)
- 3DMark 11 (720 Performance)
- Star Swarm Stress Test, 1080p Low
- Star Swarm Stress Test, 1080p Extreme
- Bioshock Infinite, 1080p Low
- Bioshock Infinite, 1080p High
- SteamVR Performance Test
- Deus Ex: Mankind Divided (DirectX 12)
- Ghost Recon: Wildlands
- Temperatures and Overclocking
- Conclusion
AMD Ryzen Lineup
| CPU | Cores, Threads | Socket | Base Clock | Boost Clock | TDP | MSRP |
|---|---|---|---|---|---|---|
| 1800X | 8 cores, 16 threads | AM4 | 3.6 GHz | 4.0 GHz | 95W | $499 |
| 1700X | 8 cores, 16 threads | AM4 | 3.4 GHz | 3.8 GHz | 95W | $399 |
| 1700 | 8 cores, 16 threads | AM4 | 3.0 GHz | 3.7 GHz | 65W | $329 |
| 1600X | 6 cores, 12 threads | AM4 | 3.6 GHz | 3.7 GHz (all cores) | 95W | $249 |
| 1500X | 4 cores, 8 threads | AM4 | 3.5 GHz | 3.6 GHz (all cores) | 65W | $189 |
Technical Details
All Ryzen CPUs adopt the 14nm FinFet manufacturing process, making them more power efficient than AMD’s previous chips. Thermal design power (TDP)--or maximum power draw--for the 1600X is 95 watts, while the 1500X is 65 watts. Both CPUs sport a shared 8MB L3 cache and 512Kb L2 cache on each core that serve as fast-access memory for the processors.

XFR--extended frequency range--is a feature specific to Ryzen CPUs with the “X” suffix. It’s a form of precision boost that recognizes your CPU temperatures and overclocks it accordingly in 25MHz increments. In theory, the more robust your cooling, the better your XFR results will be. This is one of the advantages of AMD’s SenseMI technology--built in sensors to help fine-tune performance.
The Ryzen 5 1600X is a six-core 12-thread CPU with a base core clock of 3.6GHz. It has an all-core boost of 3.7GHz and a two-core boost of 4.0GHz. With XFR active, you’ll be able to hit 4.1GHz. The second CPU we’re reviewing is the Ryzen 5 1500X, which is a four-core, eight-thread CPU. Its base core clock is 3.5GHz with a 3.6GHz all core boost and a 3.7GHz two-core boost, capable of 3.9GHz with XFR.
When it comes to choosing a motherboard for Ryzen CPUs, six chipset options exist for AM4 socket. The following chart details the chipsets:
| Chipset | USB (3.1 G2, 3.1 G1, 2.0) | SATA | DDR4 DIMM Slots | PCIe Lanes | PCIe Slots | Overclocking |
|---|---|---|---|---|---|---|
| X370 | 2, 6, 6 | 4 | 4 | 8, Gen 2 | 2 | Unlocked |
| B350 | 2, 2, 6 | 2 | 4 | 6, Gen 2 | 1 | Unlocked |
| A320 | 1, 2, 6 | TBA | TBA | 4, Gen 2 | 1 | Locked |
| X300 (SFF) | TBA | 2 | 2 | TBA | 2 | Unlocked |
| A/B300 (SFF) | TBA | TBA | TBA | TBA | 1 | Locked |
Methodology
For the purposes of reviewing the two CPUs, we put them through a gauntlet of benchmarks. These include several synthetic and scenario-based benchmarks. Our wide variety of tests aims to provide a clear picture of where these CPUs stand among the other AMD Ryzen and Intel Core-i7 CPUs. All results found in the charts were produced by GameSpot, and many of our charts use data from our previous tests from the Core-i7 7700K, 5960X, and 6950X for comparative purposes. We didn't have the Core i5-7600K on hand to test, which competes with the Ryzen 5 CPUs. In those instances, we've done research to provide you with information that should be accurate enough to give you an approximate idea of where the i5-7600K falls in relation to our other CPUs.
System Specifications
| CPU | All AMD Ryzen 7 and Ryzen 5 CPUs | Intel Core i7-6950X and 5960X | Intel Core i7-7700K | ||
| Motherboard | Gigabyte AX370 Gaming 5 | Asus Strix X99 Gaming | Gigabyte GA-170X-Gaming 7 | ||
| RAM | Corsair Vengeance 2933MHz | Corsair Vengeance 2133MHz | Corsair Vengeance 2133MHz | ||
| GPU | GeForce GTX 980 | GeForce GTX 980 | GeForce GTX 980 | ||
| SSD | WD Blue 960GB | Corsair Force LS 240GB | Seagate 600 Series 240GB | ||
| CPU Cooler | Noctua NH-U12S (Air) | Corsair H115i | NZXT Kraken X61 | ||
| Case | NZXT S340 Elite | Corsair Carbide 600C | NZXT H440 | ||
| PowerSupply | NZXT 700W | Corsair RM850X | NZXT 1200W |
All systems ran on Microsoft Windows 10 operating system.
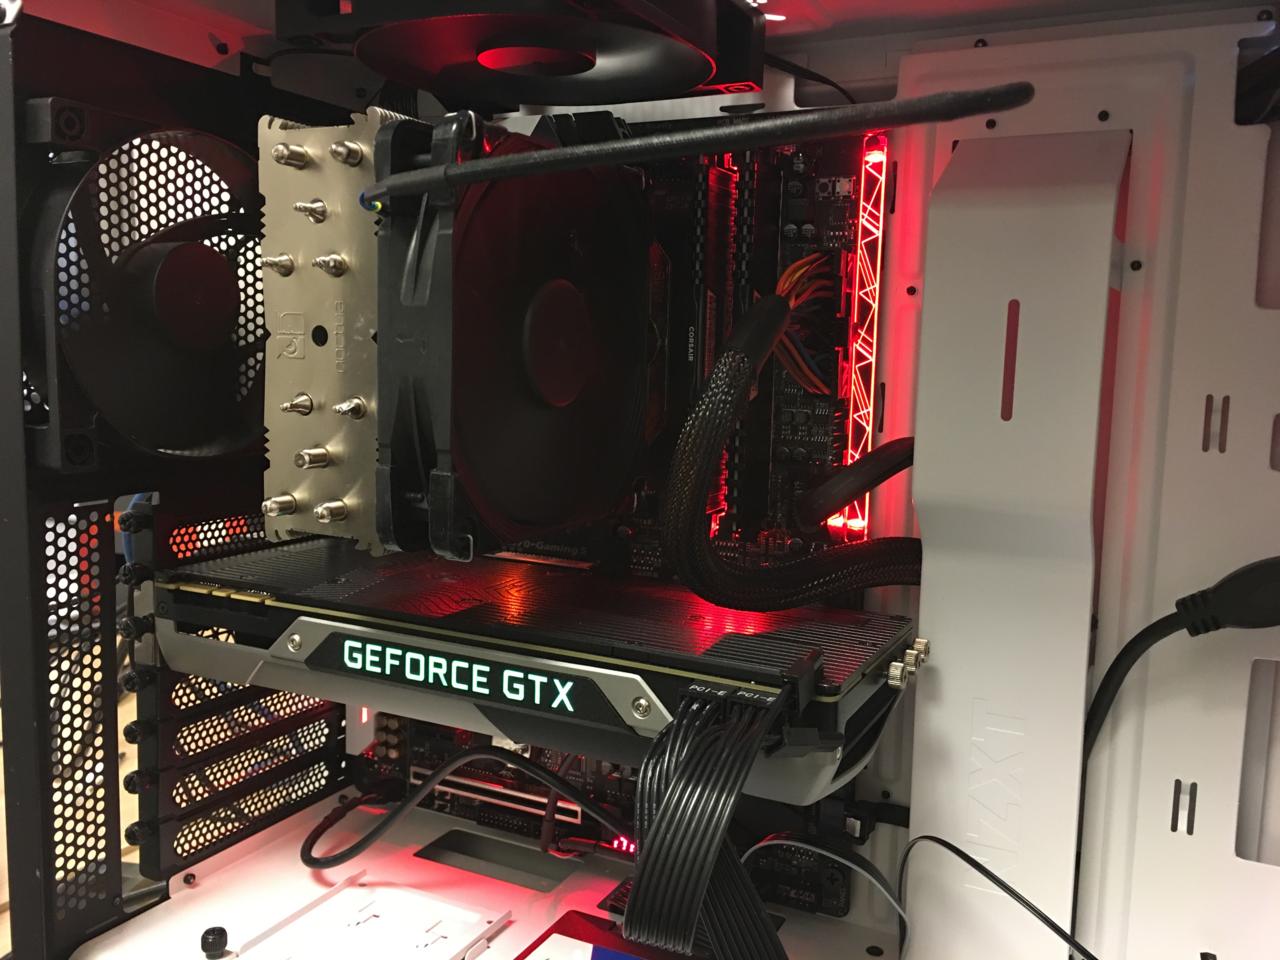
Our Ryzen test bench consisted of a Gigabyte AX370 motherboard paired with 16GB (2x8GB) of Corsair Vengeance DDR4 RAM at 2933MHz. We used the Noctua NH-U12S CPU cooler with Arctic Silver MX-5 thermal paste. For storage, we used a Western Digital Blue SATA solid-state drive and we were powered by a 700-watt NZXT power supply. For consistency’s sake, we stuck with the reference Nvidia GTX 980 for our video card. This is the same test bench used in our 1800X review.
With our overview of the CPUs and test methodology laid out, we can dig into the results.
Benchmark Results
Cinebench R15
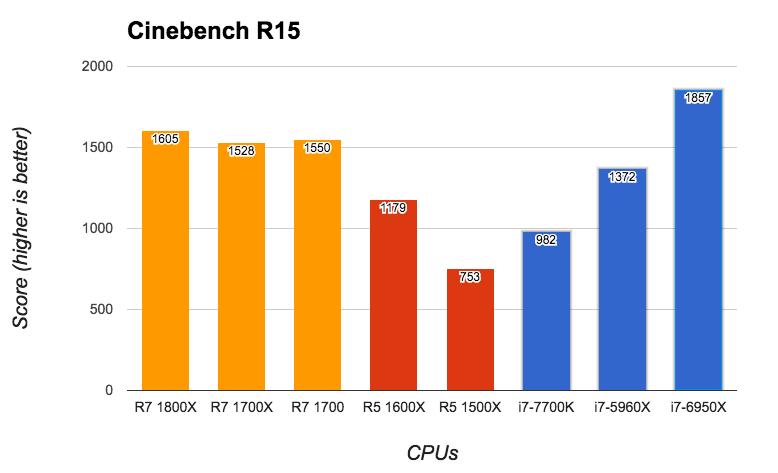
Cinebench R15 is a free benchmark tool that gives you a clear indication of how well your system performs in 3D animation and image rendering. It’s well known for stressing multiple CPU cores, and it shows in the results. The 1600X flexes its extra cores to lead the 7700K by about 20 percent. Considering the 7600K scores around 650-660, this would mean the 1500X outperforms it by approximately 14 percent.
X264 5.0.1 Pass 1
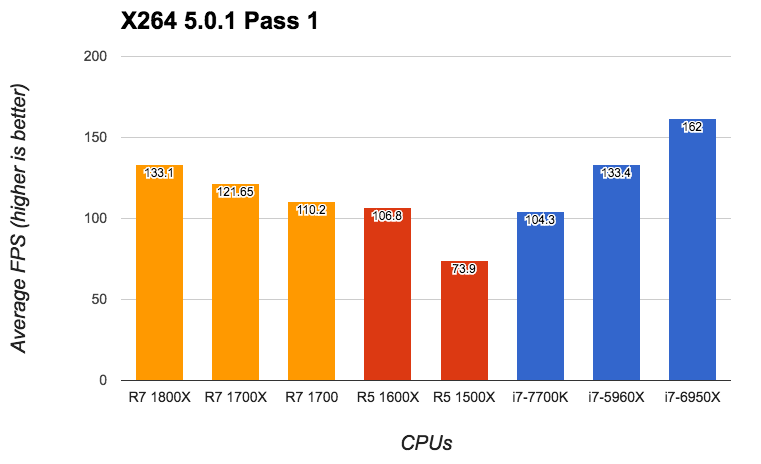
Tech ARP’s X264 benchmark is the most demanding CPU-focused test in the review. It consists of two passes that simulate video encoding. Core count is a large factor when it comes to performing well in X264, but individual core speed still matters. AMD’s 1600X is only two percent faster than the 7700K, despite having two extra cores.
X264 5.0.1 Pass 2
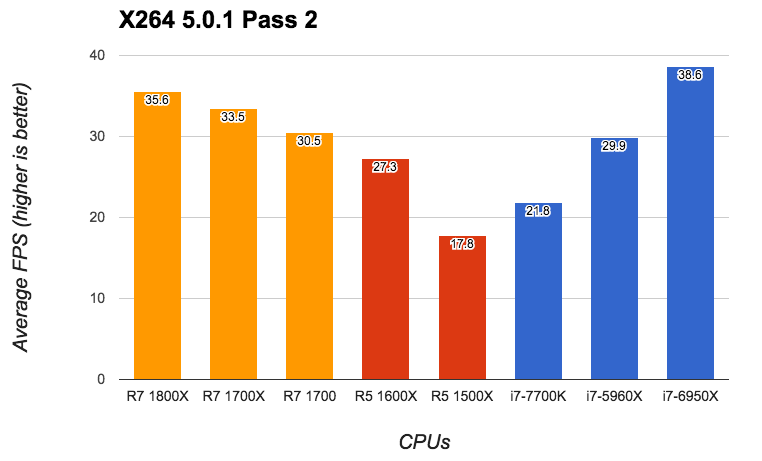
On the second pass of X264, the 1600X flexes on the 7700K with a 25-percent advantage. The 1500X trails the 1600X by 35 percent and the 7700K by 18 percent. Compared to the similarly-priced 7600K, the 1500X seems to outperform Intel's CPU by about 10 percent.does edge out the expected performance of the 7600K by roughly 10 percent.
7-Zip
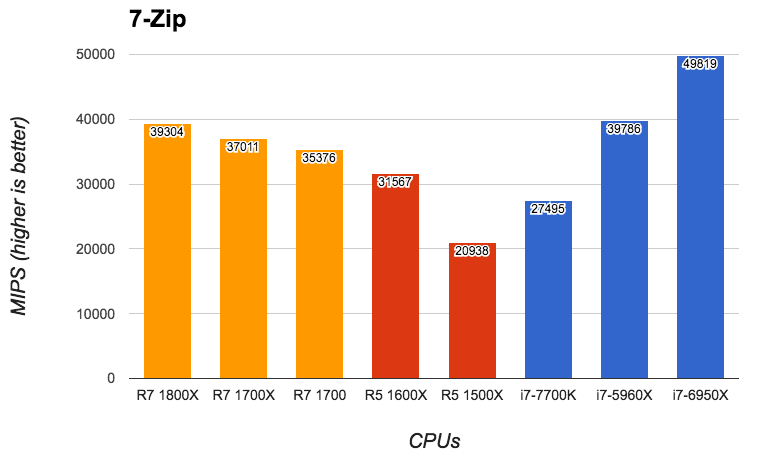
Everyone unzips compressed files at some point in their life, so 7-zip should be a familiar program. It has a built in benchmark that gives you an idea of how well your system handles compression and decompression. Multiple cores certainly help, as seen with the 1600X outperforming the 7700K by 15 percent. From data we've seen online, the 1500X performs roughly five to eight percent better than Intel's 7600K here.
GeekBench 3.0

GeekBench 3.0 is a synthetic benchmark that takes advantage of multiple cores in a CPU. While our previous tests had the 1800X performing admirably compared to all of Intel’s offerings, the 1600X keeps up the impressive showing. It trails the eight-core 5960X by just three percent, and costs a fourth less. The 1500X does fall behind the 7700K by about 11 percent, but a rough approximation of the 7600K in GeekBench 3.0 would put the 1500X at around 8-12 percent faster.
GeekBench 3.0 Single Core
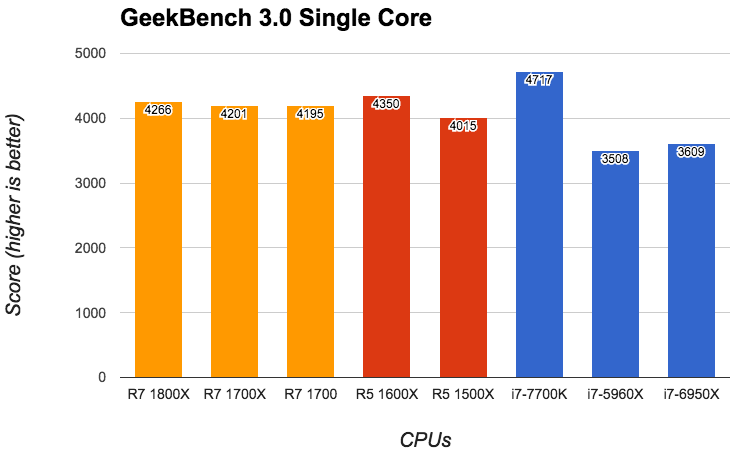
Single core performance among Ryzen CPUs stay fairly close among the different SKUs. Since they’re all built on the Zen microarchitecture, core clock speed is the main differentiator. Here we see better core efficiency out of Ryzen CPUs over the eight-core and 10-core Intel CPUs.
Blender
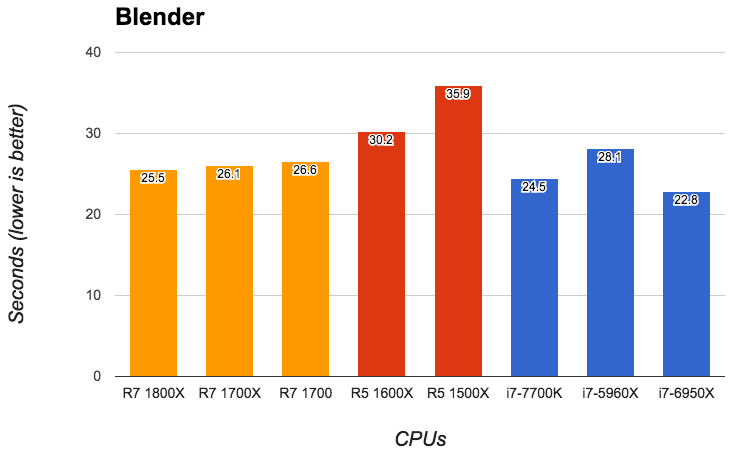
Blender is an animation and 3D graphics program that can test how fast your system renders an image. The results vary among the CPUs. The 1600X was 22 percent slower than the quad-core 7700K, but also 18 slower than the Ryzen 7 1800X. The 1500X also lags behind all the other CPUs; 19 percent slower than the 1600X.
PCMark 8 (Creative, Accelerated)

PCMark 8 is a multi-phase benchmark that simulates common use case scenarios like video conferencing, web browsing, and photo editing. Ryzen performed exceptionally well, especially considering the price tag of Intel's CPUs. We see a drop off in performance as you go down the line of Ryzen CPUs, but even the 1600X stays within seven percent of Intel's 10-core 6950X. The 1500X is behind by just 12 percent of the 6950X.
3DMark 11 (Physics Score)

3DMark 11 is a synthetic DirectX 11 benchmark that simulates performance in games. When looking at the physics score alone, you see how well CPUs handle complex physics calculations. The Ryzen 7 CPUs stayed within close range of each other, but we see a drop off once we look at the Ryzen 5 CPUs, due to the subtraction of cores.
3DMark 11 (720 Performance)

The 3DMark 11 test in 720p tells us a little more about in game DirectX 11 performance, while leaning more on the CPU. The gap closes among all our CPUs, and the 1600X is just behind the Ryzen 7 CPUs three to seven percent. The 1500X is only five percent behind the 1600X. However, the quad-core 7700K proves to be slightly faster in this case.
Star Swarm Stress Test, 1080p Low

The Star Swarm Stress Test is a benchmarking tool from the creators of Ashes of the Singularity, and simulates how your system handles having several AI units on screen through a six-minute fly-by. At low settings, where the test leans more heavily on the CPU, the 1600X stacks up with all of the Ryzen 7 CPUs, but they still lag behind the Core-i7 CPUs by about 23 percent. The 1500X falls behind the rest of Ryzen by around 18 percent.
Star Swarm Stress Test, 1080p Extreme
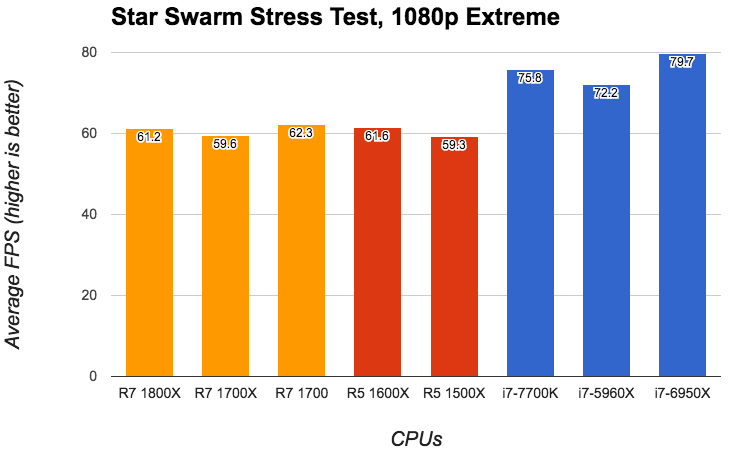
The performance gap among Ryzen CPUs closes when we crank up the settings to extreme in the Star Swarm benchmark. The game will average between 59 and 62 FPS across all of the Ryzen CPUs, but the 7700K still outperforms them by 23 to 29 percent.
Bioshock Infinite, 1080p Low
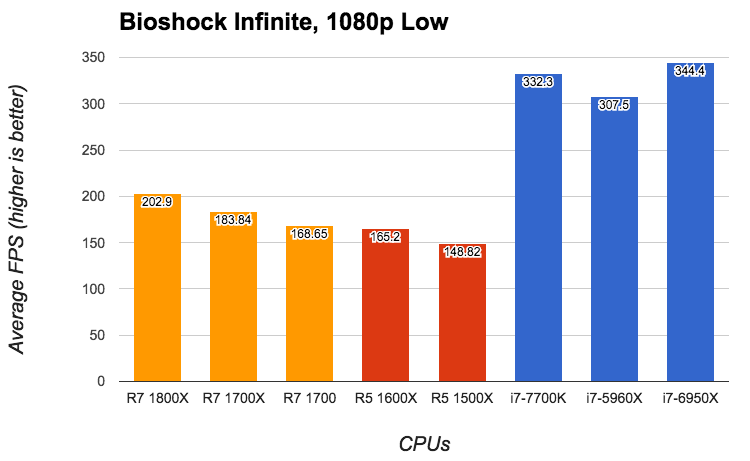
When we ran the BioShock Infinite benchmark on its low settings, the 1600X performs similarly to the 1700, but there is a noticeable drop-off with the 1500X by about 10 percent. All of the Ryzen CPUs pale in comparison to any of the Core-i7 CPUs, however.
Bioshock Infinite, 1080p High

When we move up to higher settings in Bioshock Infinite, the gap closes but Intel’s CPUs still hold a significant advantage. Among Ryzen CPUs, the 1600X actually produced a slightly better performance, but within one frame per second of the 1800X. Even the 1500X just trails one or two frames behind the other Ryzen 7 CPUs.
SteamVR Performance Test
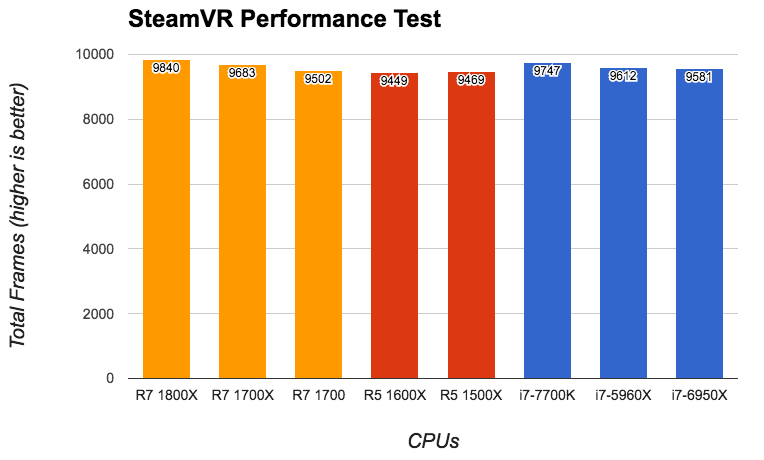
All CPUs performed very close to each other. The largest gap among them was between the Ryzen 5 1500X and the Ryzen 7 1800X, which is only a four percent difference. As for where VR is today, any of these CPUs in our tests will suffice, as long as you have the right video card.
Deus Ex: Mankind Divided (DirectX 12)

Across the board, Ryzen CPUs performed so close to each other that the differences are negligible. With the power of the GTX 980 (which is still a beefy graphics card), we were able to stay above 60 FPS with all CPUs. Deus Ex: Mankind Divided tends to ask more of systems than you would expect, however.
Ghost Recon: Wildlands
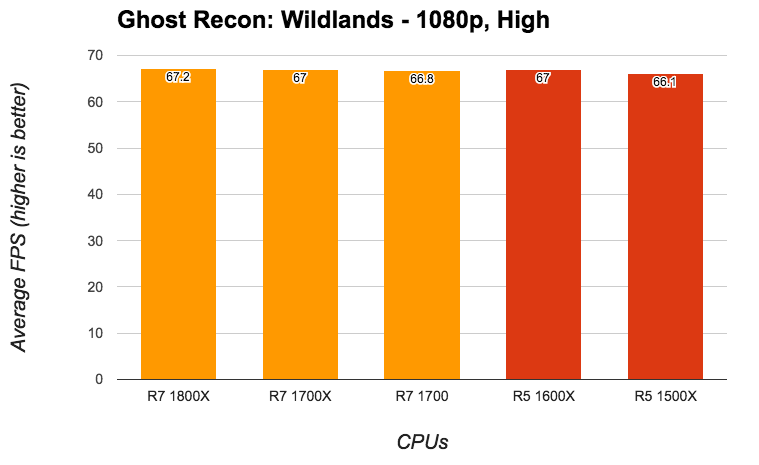
We used the Ghost Recon: Wildlands benchmark to see how the Ryzen CPUs fared in another modern game. Performance remained very much the same across the board. The highest average FPS came from the 1800X (67.2 FPS) and the lowest came from the 1500X (66.1 FPS); a meager difference of 1.1 FPS.
Temperatures and Overclocking
When it comes to temperatures, the 1600X and 1500X differ significantly, which can be attributed to their difference in power draw. At idle, the 1600X sat around 37 degrees celsius and shot up to about 78 degree celsius at load. For the 1500X, it idled around 28 degrees celsius and hit 68 degrees celsius under load.
Both the 1600X and 1500X are capable of decent overclocks. We were able to get both CPUs to manually boost all their cores to a stable 4.1GHz, which was achieved by bumping the voltage to 1.45V.

We decided to test our overclocks in X264 since it is the most demanding benchmark we used. It’s a good bar to clear for stability since the system will shut itself down if your overclock is too high. From stock speeds, the 1600X improved by six percent in Pass 1, and 13 percent in Pass 2. The 1500X improved by slightly larger margin: 10 percent in Pass 1 and 17 percent in Pass 2.
Conclusion
Both the Ryzen 5 1600X and 1500X perform admirably for their price, $249 and $189, respectively. In professional-level tasks, they gain an advantage over their competition and compare nicely to more expensive CPUs, evident in the Cinebench R15, X264, and PCMark 8 benchmarks. If you can afford the Ryzen CPUs with more cores, you’ll generally gain a proportional performance advantage.
We still don’t have an immediate need for more than four cores in modern games, and even VR. Deus Ex: Mankind Divided (in DirectX 11 and Direct X 12) and Ghost Recon: Wildlands had negligible differences among the Ryzen 7 and Ryzen 5 CPUs. Even in Star Swarm, which leverages CPU speed for better performance, the only drop off in performance was in the 1500X during the low settings test.
The bottom line is you get great bang-for-the-buck performance for most video and image processing tasks and a competent gaming CPU.
